Here’s a topic of interest in Ontario right now, as the Ontario Conservative Party under boss Tim Hudak seek to model Ontario’s labour laws after US states like Mississipi, Florida, and Alabama. Hudak has stated that, if elected, he will introduce what Americans call “right to work” legislation. We don’t know precisely what he has in mind, since he is so far speaking only in vague terms. But he has said he will prohibit ‘forced unionism’, by which we can assume he means prohibiting collective agreement clauses that require workers to pay dues.
A private members bill floated last year by renegade Tory MPP Randy Hillier went further, saying that workers who opt out of union membership would also opt out of the collective agreement altogether. That is a nutty idea because it would throw into doubt the entire labour law model and introduce some strange cross between North American and European labour law models, as Brian Langille and Josh Mandryk explain in this recent paper published in the Canadian Labour & Employment Law Journal. I’m not sure that the PC’s would draft their law along the lines of Hillier’s original Bill.
The Conservatives argue that a law that makes it more difficult for unions to collect revenue will create jobs in Ontario. It would do so because,

Tim Hudak: Would His Plan Exasperate Income Inequality?
presumably, unions would become less effective if they have less money, eventually represent fewer workers, causing labour costs (wages and benefits) to decline, making Ontario a better place to invest. In other words, this is a low wage strategy designed to put Ontario in competition with low wage American states for manufacturing jobs. Actually, the Tories don’t explain it in this way, because “the law should be used to create low wage, low benefit jobs” isn’t a great political slogan. So they actually try and argue that ‘right to work’ laws will both raise wages and benefits and create more jobs. This is political gobbly gook, to use a scientific term.
Opponents of using labour laws to crush collective bargaining point to (among other things) the direct linkage between the proportion of a working population that is covered by collective agreements and income inequality. The more people in unions, the less income inequality exists in a society. We can see this relationship in all sorts of studies and reports, many of which are cited in Professor Michael Lynk’s paper, Labour Law and the New Inequality.
Check out this fun chart that plots the relationship between union density and income inequality in American states, and that distinguishes between ‘right to work’ and ‘free collective bargaining’ states.
Unions, Inequality, and the Right to Work, Interactive Graphic
The vertical axis (up the left hand side) represents the Gini Coefficient measure of income inequality. The higher up the axis, the greater the income inequality. The horizontal axis represents the percentage of workers covered by a collective agreement. Red dots are states with laws like the one Tim Hudak would like to introduce in Ontario (‘right to work’ states). Green dots are free collective bargaining states which permit unions to collect dues through a collective agreement checkoff clause. You can search by decade (1979-2009) and state.
The first thing to note is the overall pattern: union coverage has declined across America, from almost 40% in the 1950s to only about 8% in 2009. If you compare the 1979 chart to the 2009 chart, you see a total shift to the upper left of the chart. This demonstrates that as union density in American declined, income inequality grew exponentially. You can see that relationship clearly when you chart income inequality and union density over time:

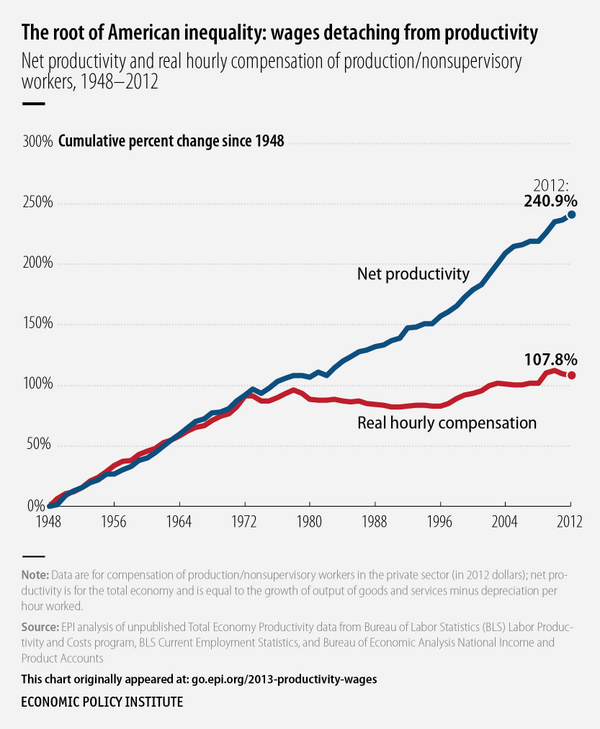
Note also, by the way, that the sharp divergence in income inequality and union density corresponds with a related worrying trend. Until the the 1970s, when union density began its spiral in the USA, wages in the U.S. grew as productivity grew. Workers shared in the prosperity their labour helped create. However, from the late 1970s onwards, as union density fell sharply in the US, wages ceased to grow with productivity gains. Workers were no longer able to bargain higher wages as their productivity increased. This is reflected in this chart:
Now, return to the original interactive chart. Notice the difference in Red and Green dots. Almost uniformly (with a few outliers), the Red dots (‘right to work states’) have both lower unionization and higher income inequality. This should not be surprising. We know empirically that unions are able to bargain a greater share of income for workers through collective bargaining than are individual employees. Since unionization tends to be lower in ‘right to work’ states, we should anticipate that a smaller share of wealth generated would go to workers. The statistics bare this hypothesis out. Here is a video that explains this chart:
Related Posts:
On Bullshit in Labour Policy Debates
Eliminating the Rand Formula Might Weaken Unions, But it Won’t Create New Jobs
Issues for Discussion
Do these sorts of economic charts persuade you that ‘right to work’ laws tend to contribute, over time, to greater income inequality? Why or why not?
If it is true that ‘right to work’ states have greater income inequality, is this a reason to reject these laws for Canada? Or would you still support ‘right to work’ laws for Canada, even if they tend to worsen income inequality?
Do you think that the linkage between ‘right to work’ laws and income inequality is a false one? If so, then is it also false to claim that ‘right to work’ laws would cause other outcomes, such as more jobs and better jobs?